
Figure 1 Map projections are mathematical equations that transform geographic coordinates (conventionally designated by the Greek symbols lambda for longitude and phi for latitude) into plane coordinates (x and y). If all the necessary parameters are known, inverse projection equations can be used to transform projected coordinates back into unprojected geographic coordinates.
Georeferenced plane coordinate systems like the Universal Transverse Mercator and State Plane Coordinates systems (examined elsewhere in this chapter) are created by first flattening the graticule, then superimposing a rectangular grid over the flattened graticule. The first step, transforming the geographic coordinate system grid from a more-or-less spherical shape to a flat surface, involves systems of equations called map projections.
Many different map projection methods exist. Although only a few are widely used in large-scale mapping, the projection parameters used vary greatly. Geographic information systems professionals are expected to be knowledgeable enough to select a map projection that is suitable for a particular mapping objective. Such professionals are expected to be able to recognize the type, amount, and distribution of geometric distortion associated with different map projections. Perhaps most important, they need to know about the parameters of map projections that must be matched in order to merge geographic data from different sources. The pages that follow introduce the key concepts. The topic is far too involved to master in one section of a single chapter, however. Indeed, Penn State offers an entire online course in Map Projections: Spatial Reference Systems in GIS (GEOG 861). If you are or plan to become, a GIS professional, you should own at least one good book on map projections. Several recommendations follow in the bibliography at the end of this chapter.
Many types of map projections have been devised to suit particular purposes. No projection allows us to flatten the globe without distorting it, however. Distortion ellipses help us to visualize what type of distortion a map projection has caused, how much distortion has occurred, and where it has occurred. The ellipses show how imaginary circles on the globe are deformed as a result of a particular projection. If no distortion had occurred in the process of projecting the map shown below in Figure 2 all of the ellipses would be the same size, and circular in shape.
When positions on the graticule are transformed to positions on a projected grid, four types of distortion can occur: distortion of sizes, angles, distances, and directions. Map projections that avoid one or more of these types of distortion are said to preserve certain properties of the globe.
Equivalence
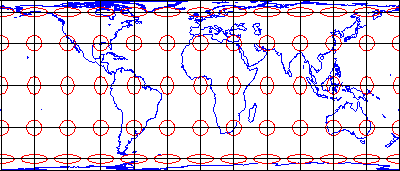
Figure 2 Equal-Area Distortion
So-called equal-area projections maintain correct proportions in the sizes of areas on the globe and corresponding areas on the projected grid (allowing for differences in scale, of course). Notice that the shapes of the ellipses in the Cylindrical Equal Area projection above (Figure 2.29.1) are distorted, but the areas each one occupies are equivalent. Equal-area projections are preferred for small-scale thematic mapping, especially when map viewers are expected to compare sizes of area features like countries and continents.
Conformality
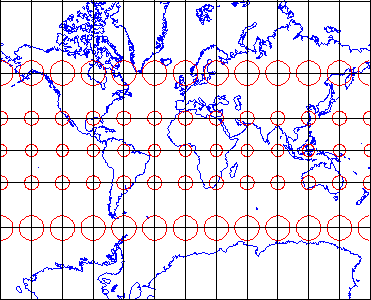
Figure 3 Conformal Projection Distortion
The distortion ellipses plotted on the conformal projection shown above in Figure 3 vary substantially in size, but are all the same circular shape. The consistent shapes indicate that conformal projections (like this Mercator projection of the world) preserve the fidelity of angle measurements from the globe to the plane. In other words, an angle measured by a land surveyor anywhere on the Earth's surface can be plotted on at its corresponding location on a conformal projection without distortion. This useful property accounts for the fact that conformal projections are almost always used as the basis for large scale surveying and mapping. Among the most widely used conformal projections are the Transverse Mercator, Lambert Conformal Conic, and Polar Stereographic.
Conformality and equivalence are mutually exclusive properties. Whereas equal-area projections distort shapes while preserving fidelity of sizes, conformal projections distort sizes in the process of preserving shapes.
Equidistance
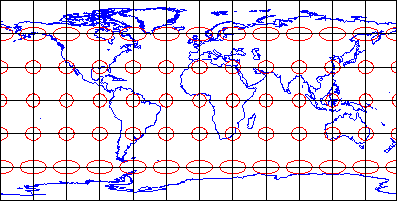
Figure 4 Equidistant projection distortion
Equidistant map projections allow distances to be measured accurately along straight lines radiating from one or two points only. Notice that ellipses plotted on the Cylindrical Equidistant (Plate Carrée) projection shown above (Figure 4) vary in both shape and size. The north-south axis of every ellipse is the same length, however. This shows that distances are true-to-scale along every meridian; in other words, the property of equidistance is preserved from the two poles. See chapters 11 and 12 of the online publication Matching the Map Projection to the Need(link is external) to see how projections can be customized to facilitate distance measurements and to effectively depict ranges and rings of activity.
Azimuthality
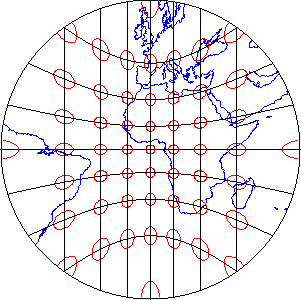
Figure 5 Azimuthal projection distortion
Azimuthal projections preserve directions (azimuths) from one or two points to all other points on the map. See how the ellipses plotted on the gnomonic projection, shown above in Figure 5, vary in size and shape, but are all oriented toward the center of the projection? In this example, that's the one point at which directions measured on the globe are not distorted on the projected graticule.
Compromise
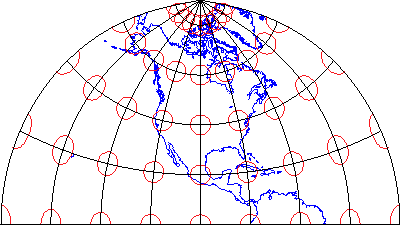
Figure 6 Polyconic projection distortion
Some map projections preserve none of the properties described above, but instead seek a compromise that minimizes distortion of all kinds. The example shown above in Figure 6 is the Polyconic projection, which was used by the U.S. Geological Survey for many years as the basis of its topographic quadrangle map series until it was superceded by the conformal Transverse Mercator. Another example is the Robinson projection, which is often used for small-scale thematic maps of the world.
Figure 2 Equal-Area Distortion
So-called equal-area projections maintain correct proportions in the sizes of areas on the globe and corresponding areas on the projected grid (allowing for differences in scale, of course). Notice that the shapes of the ellipses in the Cylindrical Equal Area projection above (Figure 2.29.1) are distorted, but the areas each one occupies are equivalent. Equal-area projections are preferred for small-scale thematic mapping, especially when map viewers are expected to compare sizes of area features like countries and continents.
Conformality
Figure 3 Conformal Projection Distortion
The distortion ellipses plotted on the conformal projection shown above in Figure 3 vary substantially in size, but are all the same circular shape. The consistent shapes indicate that conformal projections (like this Mercator projection of the world) preserve the fidelity of angle measurements from the globe to the plane. In other words, an angle measured by a land surveyor anywhere on the Earth's surface can be plotted on at its corresponding location on a conformal projection without distortion. This useful property accounts for the fact that conformal projections are almost always used as the basis for large scale surveying and mapping. Among the most widely used conformal projections are the Transverse Mercator, Lambert Conformal Conic, and Polar Stereographic.
Conformality and equivalence are mutually exclusive properties. Whereas equal-area projections distort shapes while preserving fidelity of sizes, conformal projections distort sizes in the process of preserving shapes.
Equidistance
Figure 4 Equidistant projection distortion
Equidistant map projections allow distances to be measured accurately along straight lines radiating from one or two points only. Notice that ellipses plotted on the Cylindrical Equidistant (Plate Carrée) projection shown above (Figure 4) vary in both shape and size. The north-south axis of every ellipse is the same length, however. This shows that distances are true-to-scale along every meridian; in other words, the property of equidistance is preserved from the two poles. See chapters 11 and 12 of the online publication Matching the Map Projection to the Need(link is external) to see how projections can be customized to facilitate distance measurements and to effectively depict ranges and rings of activity.
Azimuthality
Figure 5 Azimuthal projection distortion
Azimuthal projections preserve directions (azimuths) from one or two points to all other points on the map. See how the ellipses plotted on the gnomonic projection, shown above in Figure 5, vary in size and shape, but are all oriented toward the center of the projection? In this example, that's the one point at which directions measured on the globe are not distorted on the projected graticule.
Compromise
Figure 6 Polyconic projection distortion
Some map projections preserve none of the properties described above, but instead seek a compromise that minimizes distortion of all kinds. The example shown above in Figure 6 is the Polyconic projection, which was used by the U.S. Geological Survey for many years as the basis of its topographic quadrangle map series until it was superceded by the conformal Transverse Mercator. Another example is the Robinson projection, which is often used for small-scale thematic maps of the world.
Post a Comment