

NASA has just released its final 2018 data for its comprehensive global Land-Ocean Temperature Data set, and the data very clearly show that the planet is on a warming trajectory. Indeed, all five of the five hottest years on record have occurred in the past five years. Sure, there have been cold spells and winter storms during those years, but those are weather events, not climate trends. Indeed, climate change never predicted that there wouldn’t be cold winters or blizzards. Rather, the prediction always has been that the mean temperature will increase, along with other changes like increased floods in some areas, increased droughts in others, etc. (all of which are coming true).
Update 2020: 2019 was the second hottest year on record, so as of 2020, all 6 of the 6 hottest years on record occurred in the past 6 years.
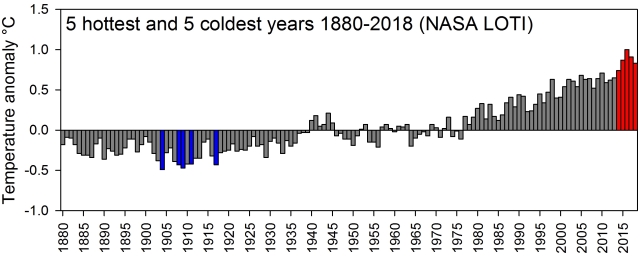
Global average annual temperature anomalies from NASA’s global Land-Ocean Temperature Index data set (1951-1980 base period). I highlighted the 5 hottest years in red and 5 coldest years in blue.
If you are someone who doubts that the climate is actually warming, then I implore you to actually look at the data. Just look at it. The warming trend is so obvious. The 20 hottest years on record have all occurred within the past 22 years! That’s incredible. If the planet wasn’t actually warming, then a trend like that should not exist. We would expect really cold years and really hot years to be interspersed together, but what we actually see is all the really cold years clumped together a century ago and all the really hot years clumped together over the past two decades.

Global average annual temperature anomalies from NASA’s global Land-Ocean Temperature Index data set (1951-1980 base period). I highlighted the 20 hottest years in red and 20 coldest years in blue.
Further, this pattern exists across data sets. For example, the HadCRUT4 dataset from the Hadley Center also shows that the past five years have been the five hottest on record. Some other data sets disagree slightly (usually with a year other than 2014 for the 5th hottest), but the overarching pattern is there, and the warming is undeniable.
But what about this notion of a global warming pause or hiatus? I wrote about that at length several years ago and explained that the only way to get a “pause” was to cherry-pick the data set, cherry-pick the starting year, and ignore confounding factors, all of which is statistically invalid. You see, satellite measurements tend to be quite sensitive to factors like El Niños. So, to create the illusion of a pause, charlatans cherry-picked a satellite data set (the RSS/MSU dataset), then cherry-picked a starting year with a huge El Niño effect (1998). Thus, by cherry-picking an unreasonable and biased starting point, they could mask the real trend. Indeed, when you account for El Niños, even those cherry-picked dates and data sets show warming (Foster and Rahmstorf 2011). Multiple studies have looked at this and consistently found that there is no pause in climate change (Easterling and Wehner 2009; Santer et al. 2011; Lewandowsky et al. 2015a; Lewandowsky et al. 2015b; Lewandowsky et al. 2018).

Data from the RSS/MSU satellite data set (TTT). Notice the massive El Niño spike at 1998. Climate change deniers like to cherry pick that as the starting point for their claim that global warming has paused. When you look at the full data set, hopefully you can see why that is invalid cherry-picking. The full data set clearly shows a warming trend. These data are monthly.
Additionally, now that several years have passed since I last wrote about the pause, let’s take a look at where things stand now. Using the TTT MSU data set and 1998 as our starting year (as deniers like to do), and using only the average temperature per year, we find a positive trend with a P value of 0.066. In simplest terms, a P value is a probability that a result as great or greater than the observed result could arise by chance, and we typically determine significance with a largely arbitrary threshold of 0.05. Thus, although this trend is not statistically significant, it is pretty dang close with only a 6.6% chance that a result like that could arise by chance (many, like me, argue that 0.05 should not be treated as a magical threshold, but that is a debate for another time). Further, I need to point out again that this lack of significance is entirely because we cheated and cherry-picked our starting year. If we start with the data in 1997 instead of 1998, the trend is significant with P = 0.028. Similarly, starting in 1999 produces a significant result (P = 0.005). In other words, if you are going to try to cherry-pick dates and argue that there hasn’t been a significant warming trend since 1998, you also have to acknowledge that there has been a significant warming trend since 1997 as well as since 1999. Do you see why cherry-picking the starting year is ridiculous now? Finally, it is worth mentioning that the barely non-significant result in 1998 is also partially due to a lack of sample size. If you use the monthly data instead of the annual means, then even starting in 1998 you get a strongly significant warming trend (P < 0.001).
There are two strategies left that people use to try to get out of the fact that the climate is changing. The first is to say that the recent warming has all been from El Niños. There certainly have been strong El Niño effects at various points, but they cause clusters of years to spike, rather than the type of decades-long trend we are in. Further, as stated earlier, removing the El Niño effect from the data sets makes the warming trend stronger, not weaker (Foster and Rahmstorf 2011).
The second strategy is to argue that the models have all been wrong. This claim is false. Sure, you can find graphs online that purportedly show that the models have been wrong, but they all use the same type of dishonest techniques that I have been describing throughout this post. Actual scientific analyses that used proper statistical methods have consistently shown that the models have been accurate (Hansen et al. 2006; Frame and Stone 2012; Rahmstorf et al. 2012; Cowtan et al. 2015; Marotzke and Firster 2015; Lewandowsky et al. 2018). More details here.
In short, the planet is warming. This is an empirical fact that is borne out by every data set available. Anyone who claims otherwise is denying evidence. This is not a “hoax” or “liberal propaganda.” It is a fact, and you don’t have to take my word for it. Just look at the data. Just look at it. The trend is obvious. When you hear people make claims like, “the scientist’s predictions have all been wrong” or ask things like, “where is global warming?” they are displaying a willful ignorance of reality.
In closing, to anyone who doesn’t believe in global warming, I would like to know what it is going to take to convince you. What evidence would convince you that you are wrong? The arguments against climate change have been the same for decades, yet year after year more data is collected showing that climate change is real and caused by us, more temperature records are broken, more extreme weather events happen, etc. At what point are you going to be willing to accept that you are wrong?
Post a Comment