

Most sky enthusiasts will have heard, at least once in their lives, of microwave background cosmic radiation, also known as the "Big Bang echo". Following on from the previous two articles on the history of the universe, we will continue this journey into the deepest cosmos by dealing in this article with the famous cosmic background radiation, which we will shorten for convenience with CBR (from the English Cosmic Background Radiation). It is one of the most important observational evidences of all for modern cosmology and to support the current vision we have of our Universe, as explained by the standard cosmological model ΛCDM. So much has been and still is its importance, that for the CBR have been dedicated three consecutive space missions, as we will see in this post.
The discovery of this radiation paradoxically happened by chance, when in 1965 Arno Penzias and Robert Wilson detected a strange background noise in the signals they acquired at the laboratories of Bell Telephone. This discovery was in fact awarded the Nobel Prize to the two technicians of Bell, obtained in 1978.
Example of black body law. The radiation emission has a trend given by Planck’s law. The maximum wavelength emission decreases with increasing temperature, as shown by the various overlapping curves, according to Wien’s law.
What exactly is CBR? We have said that it is a radiation, that is electromagnetic waves, or if you prefer photons, that have a precise energy. The radiation in question is very well represented by what is called the law of the black body, that is, an ideal case in which a body is able to absorb all the radiation that affects it and consequently to completely reject it, without any reflection (it is said that in a black body the absorption coefficient is equal to that of emission). The radiation emitted by a black body is characterized by an emission at all wavelengths (or frequencies), according to the so-called Planck’s law (see figure on the side), and becomes maximum only at a certain wavelength, which is directly related to the temperature of the black body itself (report known as Wien’s law), while the total radiance, that is, the amount of energy emitted in the unit of time by the black body along the entire frequency range (or if you prefer the pink area below the graph curve), it is directly linked to the fourth power of temperature (Stefan-Boltzmann’s law). All stars, for example, including our Sun, emit just like a black body. CBR is therefore also a black body radiation, corresponding to a temperature of up to 2,725 degrees Kelvin.
h f = k T
where h is the Planck constant, k is the Boltzmann constant, T is the temperature of the black body we mentioned earlier, and f is the corresponding frequency of the radiation we want to calculate. Replacing the values and deriving f from the formula, we obtain that f 50 Ghz (giga Hertz), that is, we are in the microwave regime, from which the alternative name derives. This report also makes us understand that a higher temperature corresponds to a higher frequency, that is to a smaller wavelength. Conversely, a smaller temperature produces a lower frequency, and thus a longer wavelength.
What are the main observational properties? We have already said that CBR is represented by the thermal spectrum of a black body, with a temperature in the microwave regime. In addition to this, it is observable in whatever direction one observes, that is, anywhere in the Universe. Another fundamental characteristic is that it is not in fact perfectly homogeneous at every point, but its peak temperature has very slight fluctuations (also known as anisotropes, or unevenness), according to which direction it is observed, with variations in the order of one hundred thousandth degree Kelvin (10-5 K) with respect to the central temperature value. Later on we will understand why these fluctuations, although small, are essential for the study of the Universe. Finally, the photon density of CBR, which is the number of photons of CBR plus. The CBR at the last scattering horizon is analogous to the light that comes through the clouds to our eye on a cloudy day.per cubic centimeter, is equal to 411 photons/cm3 a very small value compared to the total of photons we receive from space, equal to about 100 thousand times
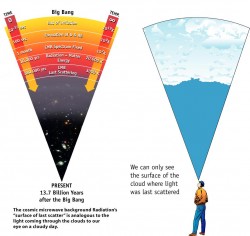
How did CBR generate? It corresponds to a precise physical process, predicted by the Big Bang model, the theory that the Universe in the past was reduced to a very small volume, extremely dense and warm, then expanded and cooled down to the present day. The physical process in question is recombination, occurring at the time when the primordial plasma, consisting of photons, electrons and protons before then walking in the plasma separately from each other, Because of the expansion of the Universe, it cooled to the point where the electrons could form the first atoms together with the protons, without the bond being destroyed by the very strong thermal energy, causing the photons to begin to be absorbed. To understand what this means, just imagine looking towards the sky on a cloudy day. We will in fact see the surface of the clouds facing us, and we will not be able to see further because of the fact that the light cannot cross the cloud cover, as the figure shows. Recombination therefore represents by analogy that moment in which the Universe has passed from having a "consistency" so to speak analogous to that of a cloud, to a condition of transparency like that of the air that surrounds us in the absence of clouds.
Where did the CBR come from? The last scattering horizon is the place from which the CBR was issued, and corresponds to a surface at the time of recombination, which occurred about 380 thousand years after the Big Bang. At the time of release the CBR had a temperature of 3000 degrees Kelvin, so much higher than today. By analogy with the previous figure, the horizon of last scattering would represent the surface of the cloud blanket at the bottom, that is, the one facing us.
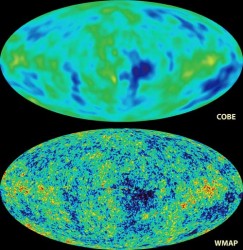
But now to the observations that allowed us to understand the properties of this radiation. The first satellite to realize a global mapping of the CBR has been COBE (Cosmic Background Explorer) in 1989, which has exploited the so-called DMR (Differential Microwave Radiometers) to be able to detect temperature variations by comparing portions of the sky in diametrically opposite directions, and reaching an angular resolution of 7 degrees and a temperature accuracy of about 1 thousandth of degree Kelvin, or 1 mk (millikelvin). COBE also made it possible to reconstruct the entire thermal spectrum of CBR, thus confirming that it behaves like an almost perfect black body and measuring the characteristic temperature of 2,2725 K that we know, in addition to the photon density mentioned earlier. This was possible thanks to the presence of another instrument on board the satellite, known as FIRAS (Far Infrared Absolute Spectrophotometer).
So what did COBE find? We see it depicted in the image at the bottom left, in three different phases of extraction. In fact, the actual measure corresponds to the first map at the top, which we see clearly marked by only two regions, one in blue and one in red, representing an effect of distance and approach (blueshift and redshift, respectively) of the observed radiation. This first map does not actually display anything from CBR, and it is called a dipole component. The dipole component is nothing more than a component that is generated when we move relative to the source, in which case it is represented by the CBR and fixed around us (that is, not in motion).
 Map of CBR
The motion that causes the dipole component is precisely that of our Solar System. This causes us to see the radiation of one half of the sky, the one facing the same direction of motion, approaching us, displayed as warmer temperature in red. This effect is due to the fact that when the source approaches us (or rather in this case we approach the source, but the principle is identical), its frequency becomes higher, and therefore corresponding to a higher temperature according to the formula that we saw initially in this article. Conversely, the other opposite half of the sky will see the source move away, causing a redshift and then decreasing the frequency, that is, lowering the temperature (which we see colored in blue). The first necessary operation is therefore to eliminate this dipole component. With appropriate calculations of the motion of the Solar System, it is possible to quantify it and then remove it from the map with a subtraction. What we get is the second figure in the center. In this figure we already see several spots scattered here and there, but in particular we notice a prominent red region horizontally. This component is not a huge unevenness in the CBR but is the effect of our galaxy, the Milky Way, observed by cutting that is along the plane of the galactic disk. Because of the high density of stars along the plane of the disc, we see a temperature increase that becomes dominant due to the strong radiation emitted in its correspondence. Also this source is to be removed to the total, so as to further clean up the map and leave us exclusively the contributions given by the CBR. Once this second correction is done, the final result we get is shown in the third map below. Here is finally the CBR with its anisotropy, that is the hottest and coldest "spots" that appear throughout the map. It should be noted, however, that these spots, so marked and evident in the map in false colors, are only very small variations in temperature compared to the value of 2.2725 K, equal to about 0.00001%, so very small. The reason why we see them so evident in the map is because it has been chosen a scale of colors specifically calibrated to be sensitive to this order of variations, so do not panic, the CBR continues to be globally rather homogeneous!
How can we interpret CBR temperature fluctuations? We said that a higher temperature corresponds to photons that have a higher energy, or a higher frequency. The way to explain how these variations were produced is to bring up the density of the primordial fluid. A higher density corresponds to a greater compression of the primordial fluid, and therefore to a higher temperature according to the laws of thermodynamics. Conversely, a lower density implies a decompression, that is, a region that is more rarefied, and consequently a lower temperature. What does all this mean? That the early Universe, that is, the Universe before the CBR was emitted, and at the time when the CBR was produced, was in fact not really homogeneous, but had denser and less dense regions, as we can see clearly from the spots on the CBR map produced by COBE. This then makes us understand that these very small fluctuations have a very important meaning, that is, they tell us how uneven the Universe was and also in which directions. Understanding heterogeneity allows us to shed light on the formation of stars, galaxies and galaxy clusters.
 WMAP.
WMAP.Intuitively, in fact, we can understand that the regions with higher density were then fertile ground for the birth of stars and galaxies, thanks to the presence of a greater amount of matter. Conversely, the lower density regions are associated with the large voids present in the Universe we observe, where the scarce presence of matter has not allowed the swarming of stellar and galactic formation.
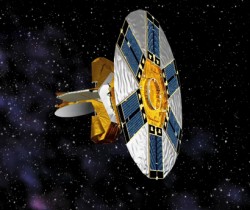
At this point you can understand that the level of detail with which we can observe these anisotropies is a fundamental aspect to be able to be as precise as possible in deducing the behavior and distribution of the same throughout the CBR map. For this reason, and since the angular resolution of COBE was certainly not the best obtainable, NASA decided to send into orbit a second satellite in 2001, known as WMAP (Wilkinson Microwave Anisotropy Probe), with an angular resolution of as many as 20 (first degree)about 20 times finer than COBE’s, therefore, by detecting temperature variations of up to 10 millionths of Kelvin. WMAP has made a huge contribution to improving our knowledge of the CBR and the early Universe, as the detail achieved in mapping it has been considerably higher than that previously obtained by COBE, as shown in the figure at the bottom left in the same color scale.
Such a level of resolution made it possible for the first time to use WMAP data from CBR to obtain constraints on cosmological parameters, that is, parameters that regulate the evolution and composition of our Universe.
 map of CBR, from satellite COBE to WMAP.
Going a bit more into the details of observations with WMAP, we can identify two basic types of anisotropies:
Primary anisotropes: these are temperature variations present at the time the CBR was produced, that is, coming directly from the last scattering horizon. They were caused by variations in density, gas velocity, and gravitational potential on the surface of the last scattering horizon.
Secondary anisotropies: are additional temperature variations produced instead by the presence of large clusters of galaxies along the route that photons have traveled to get to us from the horizon of last scattering. The effect is due, as we will see later, to the holes of gravitational potential.
In other words, the magnitude of these fluctuations (that is, how large is the variation in temperature), and their characteristic size in angular terms on the map, give us direct information about the history that photons have lived, that is, what they came into contact with and that generated them, thus providing us with radiation.
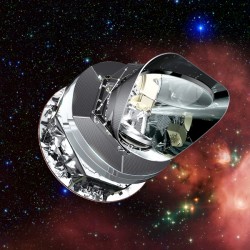 Il satellite spaziale ESA Planck.
In very recent times, namely in 2009, ESA sent into orbit the third space mission dedicated to the study of CBR and with the aim of further improving the observations of WMAP, we are talking about the satellite Planck. Planck is also proud to have an Italian instrument on board that is all Italian, we are talking about the LFI, the Low Frequency Instrument, which together with the second instrument, the HFI (High Frequency Instrument) allowed to realize the most detailed map obtained to date of the cosmic background radiation. Planck has in fact achieved a resolution of up to 10 minutes of arc, thus doubling the level of detail of the previous WMAP, and reaching a temperature sensitivity up to the millionth degree Kelvin, 1 μK (microKelvin), thus allowing to see also very thin fluctuations (10 times more sensitive than WMAP therefore), as shown in the image comparison below, a point of great relevance in order to further constrain the models of the Universe.
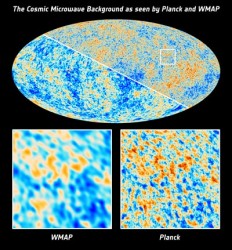 The CBR map comparison obtained from WMAP and Planck, using the same color scale.
The use of instruments with different frequency bands has allowed researchers to separate very accurately contributions from the galaxy from those exclusive to CBR. As we have seen in the case of COBE, this step is basic in obtaining an accurate final map of cosmic radiation. Any contamination from other sources can produce deleterious effects on the interpretation of the signal we receive and for this reason the possibility of observing the sky at different frequency bands is of particular importance.
Planck’s ability, also better developed than its predecessor WMAP, is linked to its ability to measure CBR polarization. Polarization is a measurable property for any electromagnetic wave, and is linked to the fact that the wave itself is represented by an electric field and a magnetic one that oscillate in an orthogonal direction between them. I’m sure you’ve heard of it if you ever bought a pair of sunglasses. The polarization represents the direction in which the electric field that constitutes the electromagnetic radiation oscillates, as shown in the figure below.
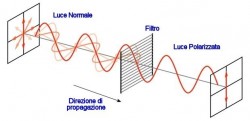
Diagram of the polarization of an electromagnetic wave. Assuming that the wave is initially non-polarized (that is, the electric field oscillates in all directions) and superimposing a filter with a single preferential direction, the wave passing through the filter becomes polarized, that is, the electric field will swing in the only direction allowed by the filter. A similar pattern is in action in polarized sunglasses, for example.
Sunglasses are sometimes polarized appropriately precisely because they allow us to block the passage of certain radiation that is harmful to our eyes, such as UV rays. This means that radiation can in general (but not always) show a preferential direction for the oscillation of the electric field, thus telling us that some phenomenon in particular has affected the radiation we observe, or that it was actually produced with this property because of a very precise mechanism. This property then gives us more information about the sources that produced the radiation and the physical characteristics of the medium with which it came into contact. Well, what Planck discovered, an attempt already made by WMAP but not sufficient to draw conclusions for that period, is that the CBR has a small polarized part, that is, a portion of cosmic radiation has an electric field oscillating in well-defined directions. This study is currently being developed and will allow cosmologists to add further detail to constrain the cosmological model that describes the Universe.
Post a Comment